# Build elettra lattice
# Load ELEGANT input file and build lattice
file = Path('./elettra.lte')
data = load_lattice(file)
ring = build('RING', 'ELEGANT', data)
# Flatten lattice
ring.flatten()
# Remove all marker elements but the ones starting with MLL (long straight section centers)
ring.remove_group(pattern=r'^(?!MLL_).*', kinds=['Marker'])
# Merge drifts
ring.merge()
# Slice dipoles
ring.ns = (('Dipole', 0.05), )
# Profile
layout = Layout(ring)
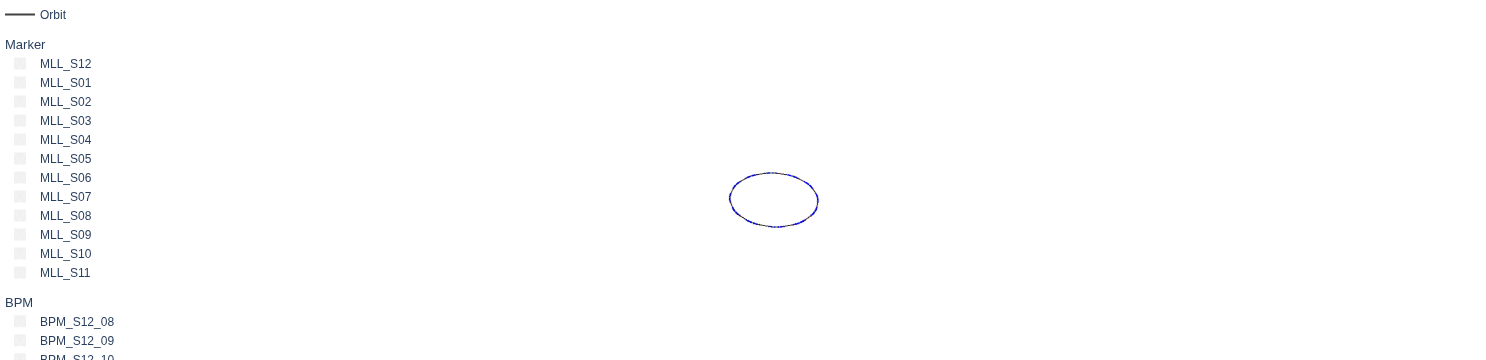
# Generate reference orbit
x, y, z = layout.orbit(flat=False, step=None, start=(0, 0))
# Generate layout (can be saved as html with write_html method)
blocks = layout.profile_3d(scale=2.5, exclude=['Drift'])
# Plot
figure = graph_objects.Figure(
data=[
graph_objects.Scatter3d(
x=x.numpy(),
y=y.numpy(),
z=z.numpy(),
mode='lines',
name='Orbit',
line=dict(color='black',width=2.0,dash='solid'),
opacity=0.75,
showlegend=True
),
*[graph_objects.Mesh3d(block) for block in blocks]
]
)
figure.update_layout(
scene=dict(
xaxis=dict(visible=False, range=[-100,100]),
yaxis=dict(visible=False, range=[-100,100]),
zaxis=dict(visible=False, range=[-25,25]),
aspectratio=dict(x=1, y=1, z=1/4),
annotations=[]
),
margin=dict(l=0, r=0, t=0, b=0),
legend=dict(orientation='v', x=0., y=1., xanchor='left', yanchor='top'),
hoverlabel=dict(font_size=12, font_family="Rockwell", font_color='white'),
legend_groupclick='toggleitem'
)
figure.show()